2 Introduction
R statistical software and associated tools have the potential to increase your efficiency, simplify collaboration, and develop reproducible products. Often the biggest limitation to these tools is lack of awareness. This document is intended to provide you with an overview of some of the many R-related tools and is intended for individuals with at least a basic understanding of R. We will learn to create R functions, a robust project structure using R Studio, aesthetically pleasing documentation with R Markdown, and interactive tools with Shiny. In addition, we will delve into the ecosystem of packages developed by R Studio, known as the Tidyverse (e.g., dplyr, tidyr, purr, and ggplot2), which provide useful and intuitive functions for data manipulation, processing, and visualization. Overall, this document will provide you with the working knowledge of some of the most widely used R related tools available for your next project.
2.1 Goals
- To make you aware of the tools available to you.
- ggplot2 for creating figures
- dplyr and tidyr for data manipulation
- lubridate for handling and formatting dates
- rmarkdown for creating documents
- shiny for creating interactive apps
- To provide you with the vocabulary and understanding of R syntax to…
- Understand how to ask meaningful questions
- Understand how to use functions
- Interpret example code
- To provide you with an overview of project structure
- Understand where to start
- Understand tools that are available to you for project development
- RStudio
- R-Projects
- Git + GitHub
- rmarkdown
R, like any other skill, is going to require you to invest a time to practice. I cannot help you with time management, but I can provide you with an 1) awareness of tools available and 2) the vocabulary and understanding of syntax to make practicing less frustrating.
2.1.1 Tip
A good way to invest more time in R is to use R in situations where you would normally use MS Excel.
2.2 What is R?
R is an open source programming language developed for statistical computing and graphic production. “R can be considered as a differenct implementation of S”, a language that was developed at Bell Laboratories (https://www.r-project.org/about.html).
2.2.1 Benefits of Using R
- Reproducibility: Standardized processes (e.g., functions, loops, documentation)
- When using MS Excel processes are often spread across multiple sheets or calculations are performed haphazardly within a single sheet. In general, this makes it very hard to interpret processes performmed and to reproduce the process.
- Power: Ability to perform simple and complex data manipulations, iterative processes, and calculations
- Access to more than 10,000 packages on CRAN
- New packages are constantly being developed
- New features are contsantly being added to existing packages
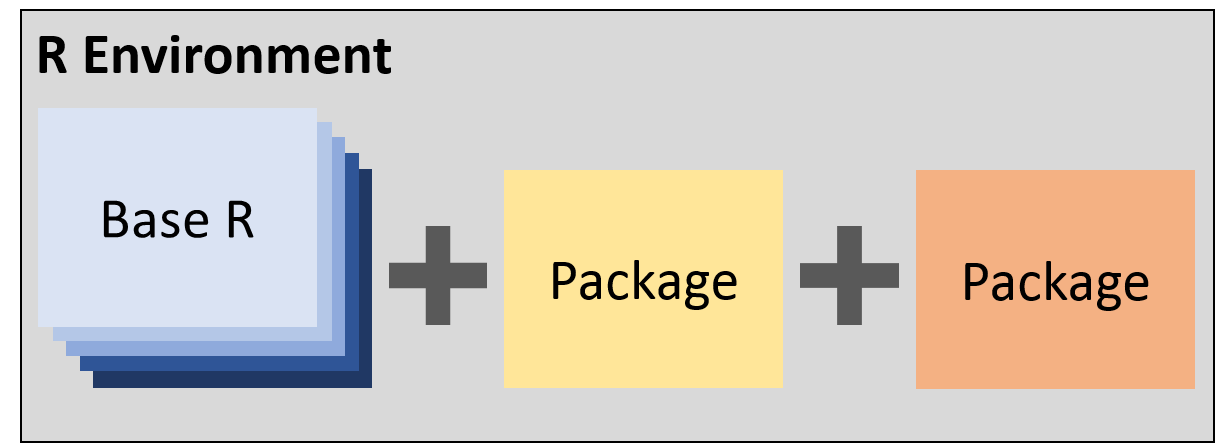
2.2.2 R Packages
R packages are extensions of base R that provide additional features or provide alternative functionality.
- Availability
- CRAN (https://cran.r-project.org/)
- The Comprehensive R Archive Network (CRAN)
- FTP and web servers that store R Packages
- Packages are rwquired to meet certain standards
- GitHub (https://github.com)
- These packages are usually under development
- Contains development versions of many packages available on CRAN
- Custom (http://r-pkgs.had.co.nz/)
- You have the ability to create your own packages.
- CRAN (https://cran.r-project.org/)